.png?width=132&height=33&name=image%201%20(3).png "Dober logo")
FluidIQ™ · Know what your glycol loop is doing.
Data Center Glycol Monitoring
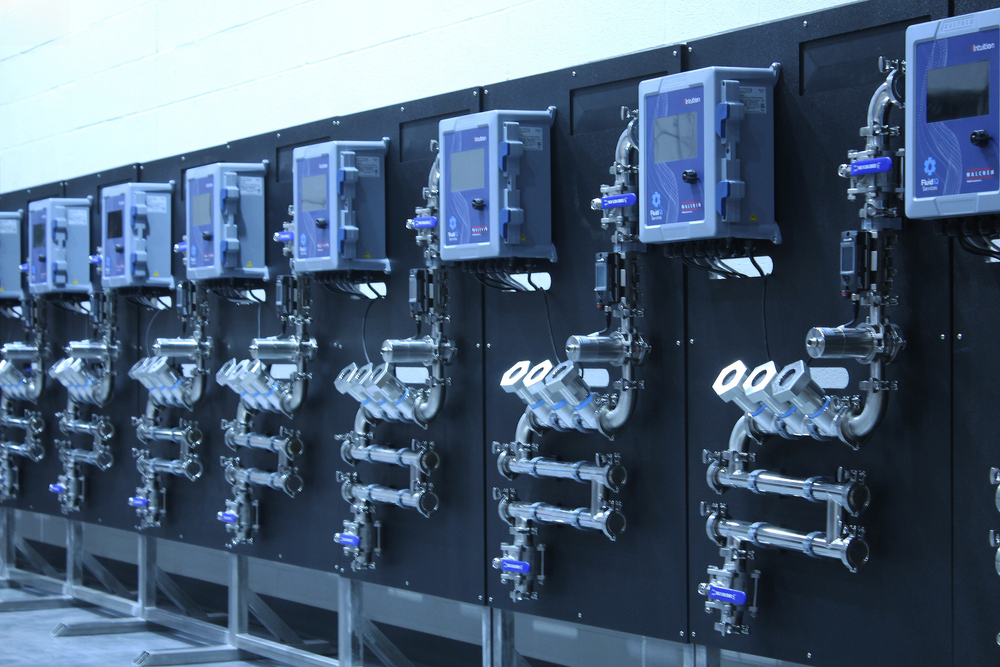
The FluidIQ™ Glycol Monitoring Panel tracks glycol concentration, turbidity, pH, and conductivity in real time and feeds it straight to your DCS or BMS. Designed, built, and supported by Dober.
The Problem
A quarterly sample tells you what the fluid looked like a month ago.
A glycol loop drifts. Concentration changes as glycol degrades. pH moves as inhibitors deplete or coolant degrades. Turbidity and conductivity climb as the system picks up contamination. None of it announces itself.
The standard answer is routine sampling that gets shipped to a lab, with results that come back in days to weeks. In a liquid-cooled data center running at density, weeks are a long time to be guessing.
What It Monitors
Several parameters. Measured continuously.
Glycol Concentration
Confirms the loop is holding the fluid it was filled with. In a data center loop, concentration is the microbial control: OCP treats PG 25 as biostatic only while it stays above 25% glycol, and the allowable band is 24.5 to 29.5%.
Continuous measurement shows the drift while there is still time to correct it instead of drain and fill.
pH
Tracks the chemistry that keeps the inhibitor package working. A drifting pH is the early signal that fluid protection is degrading.
Conductivity
Flags changes in system chemistry and contamination.
Turbidity
Measures fluid clarity. Some suspended solids, oil, or entrained air show up as a turbidity change, so a clouding loop is a trend you watch build, not a surprise in a sample bottle.
Dissolved Oxygen
Optional
Oxygen entering a closed loop supports oxidation of the glycol and the metal it touches. Tracking dissolved oxygen shows whether air is getting in through makeup water, leaks, or the expansion tank before the chemistry shows the damage.
Biofouling
Optional
Microbial growth in a glycol loop can foul heat transfer surfaces and restrict flow. Biofouling monitoring gives an early read on biological activity.
Corrosion Rate
Optional
Probes read the instantaneous corrosion rate of the specific alloys in your loop in mils per year. Coupons are effective but give you an average a week or months after the fact.
All parameters are measured continuously and reported live. No sample bottle, no shipping, no waiting.
How It Fits Your System
Reports where your operators already look
Talks to what you already run
The panel integrates with existing DCS and BMS infrastructure, so the data lands where your operators already look, at the control room level.
Reduces the frequency of manual sampling
Automated monitoring replaces most of the routine sample-and-ship cycle.
Trends the fluid and flags rapid change
Continuous data lets you trend the health of the heat transfer fluid over time and get notified when a property moves fast: glycol concentration, pH, conductivity, turbidity, and, depending on the sensor suite and fluid, inhibitor levels, dissolved oxygen, and bio-fouling indicators.
Built to the project
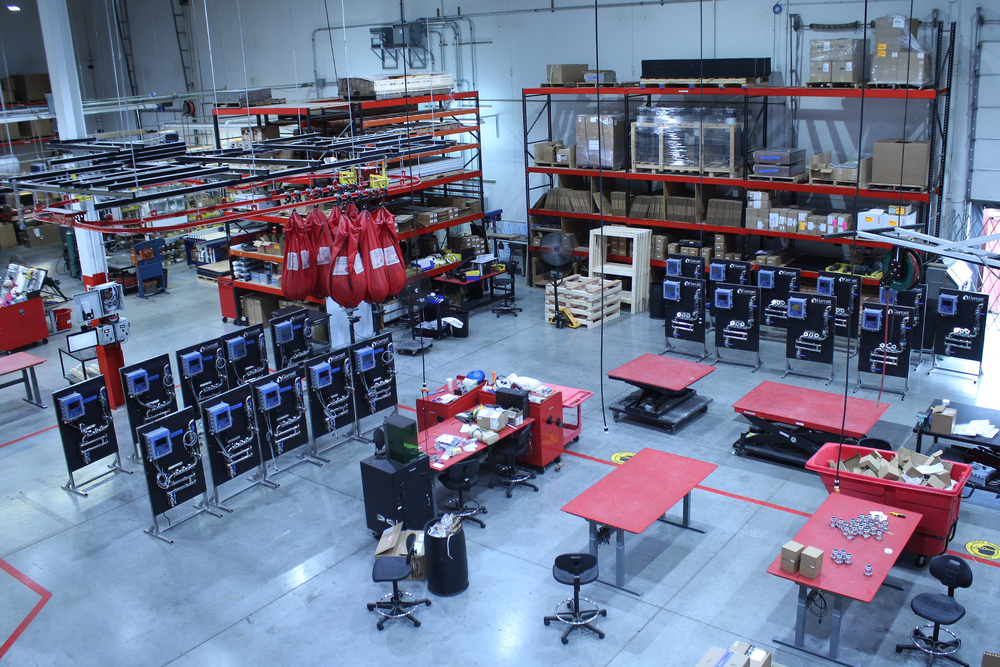
Dober designs, manufactures, and sells these panels. The configuration, the connection points, and the parameter set are decided with you, and the drawing you get is the panel you receive.
For Contractors
Building the submittal? Everything you need is here.
- Current dimensional drawing
- Weights, clearances, and mounting detail
- Connection sizes and locations
- Electrical requirements
- Parameter and instrument list as configured
Why Dober - Proven across 4,500+ chemical delivery systems
An Equipment Mindset Since the Mid-1980s
Dober has been solving chemical and operational problems since 1957. Equipment fabrication has been part of that story since the mid-1980s, when Dober’s early work included portable clean-in-place equipment.
Today, that same equipment mindset shows up across the business: cooling tower skids, glycol monitoring hardware, and connected dosing systems for commercial laundries.